Assignment 5
Continuous TQ improvement methods. TQM graphical methods.
Author: Hardik Bharatkumar Gala
Class code: IE673 live
Date: December 14, 2011
eLearning Pack ID : IE 673-Fall 2011-60-35
Statement: All contents of this assignment were submitted by Hardik Gala
Contents:
· Introduction and objectives:
· PART 0 – Resubmit all reworked assignments:
· PART 1 - Methodologies applied for incorporation of RFID
o CIMpgr models
o CORA
o PFRA analysis
· RFID integration CIMpgr process models
· RFID integration into CORA charts
· RFID integration into PFRA
· PART 2- Quality audit
· Application of the various methods learnt from the assignments to improve RNR Pvt. Ltd.
· Addressing Audit issues
· Panorama Navigation Map
· Video conferencing
· Press release
· Summary
· Further Work Needed
· References
· PART 0 – Resubmit all reworked assignments:
All assignments were submitted on time.
The final version of each assignment is hyperlinked below
· Introduction and objectives:
The assignment 5 has been divided into 3 parts. The first part is incorporating RFID technology into CIMpgr process models, CORA charts and analysis of risks in PFRA charts. The second part consists of conducting a TQM audit. Finally the third part consists of a video conferencing session.
The objective of the first part of the assignment is to incorporate RFID in RNR Pvt. Ltd. Radio-frequency identification (RFID) is a technology that uses radio waves to transfer data from an electronic tag, called RFID tag or label, attached to an object, through a reader for the purpose of identifying and tracking the object. Some RFID tags can be read from several meters away and beyond the line of sight of the reader. The application of bulk reading enables an almost-parallel reading of tags. The tag's information is stored electronically. The RFID tag includes a small RF transmitter and receiver. An RFID reader transmits an encoded radio signal to interrogate the tag. The tag receives the message and responds with its identification information. Many RFID tags do not use a battery. Instead, the tag uses the radio energy transmitted by the reader as its energy source. The RFID system design includes a method of discriminating several tags that might be within the range of the RFID reader.
Another objective of this assignment is to conduct a TQM quality audit to ensure that we are following all the set standards and regulations and that we are conforming to the ISO 9001:2008 principles/standards. Quality audit is the process of systematic examination of a quality system carried out by an internal or external quality auditor or an audit team. It is an important part of organization's quality management system and is a key element in the ISO quality system standard, ISO 9001.
· Methodologies applied for incorporation of RFID:
1. CIMpgr models
A complete CIMpgr model is a set of diagrams which systematically illustrate the object-to-object relationships between the objects, their functions and entities. The diagrams are often arranged in a layered, tree-like fashion, illustrating a parent-child relationship. It is a complex system in which at top of the tree there is a very high-level description of the entire system and further down the tree one goes, so the descriptions of the individual parts (objects) of the system become more detailed. Making a complete CIMpgr model of a system is an iterative process.
2. CORA
Component Oriented Requirements Analysis (CORA), represents a systematic, customizable method, based on QFD (Quality Function Deployment) and other methods, developed by DR. Ranky to analyze product/ process, TQM / TQC needs, including product, process, IT, service, and other needs. CORA is a Team Oriented Problem Solving (TOPS), method, aimed at minimizing dissatisfaction, and financial loss due to inadequate requirements specification, and poor communication between customers and providers.
Our CORA code is integrated in four modules, these being:
· User requirements
· Engineering solutions
· Parameter calculations
· Benchmarking.
3. PFRA analysis
Process-related failure risk analysis method belongs to the family of failure mode and effect analysis (FMEA) methods, and is part of our TQM and Six-Sigma approach. It represents a systematic, rule-based, quantitative and open-source computational method developed by Ranky first for disassembly (DFRA), and then for other processes (PFRA) to identify and minimize potential failure risks, and / or failures of processes in general, including disassembled sub-assemblies, objects and components, and their effects on the customer. PFRA is a Team Oriented Problem Solving (TOPS) method, aimed at minimizing dissatisfaction, and financial loss for process related failure risks. PFRA is applied during the planning stages of a process, and then updated on a regular basis to document changes.
There are 7 key aspects of this generic methodology. They are
· Define, scope, function and purpose:
It defines the system or sub-system, or any product, or process (including service) design to be analyzed.
· Identify potential failure risks and failure modes and their effects:
This means that by applying the PFRA technique during the process, and creating, or analyzing the existing BOM (Bill of Material) file, the team should be able to gradually deepen the product, process or system design analysis and locate all potential failures at the earliest possible stage.
· Prioritize potential failures:
This means that all faults should be ranked and critical quality, or cost, or safety related faults should be located and eliminated by the cross-functional team as early as possible.
· Select and manage subsequent actions:
This aspect of PFRA means, that in cases in which the risk of potential failures is high, following our basic TQM principles, an immediate control plan must be devised and subsequent actions should be taken to control the situation.
· Observe and learn:
For each system or product/process design, PFRA / DFRA represent a dynamic, living knowledge-managed document that needs to be kept up-to-date.
· Document the process:
Team stores the PFRA / DFRA contained information in a widely accessible format (preferably, both electronically, such as our spreadsheet and optionally on paper based media) for the current as well as for future teams.
· Enter the values into the PFRA/DFRA spreadsheet on a relative scale:
This is determined by the local PFRA / DFRA Team, as well as by the local, customized standards they follow.
· RFID integration CIMpgr process models:
Layer 0:
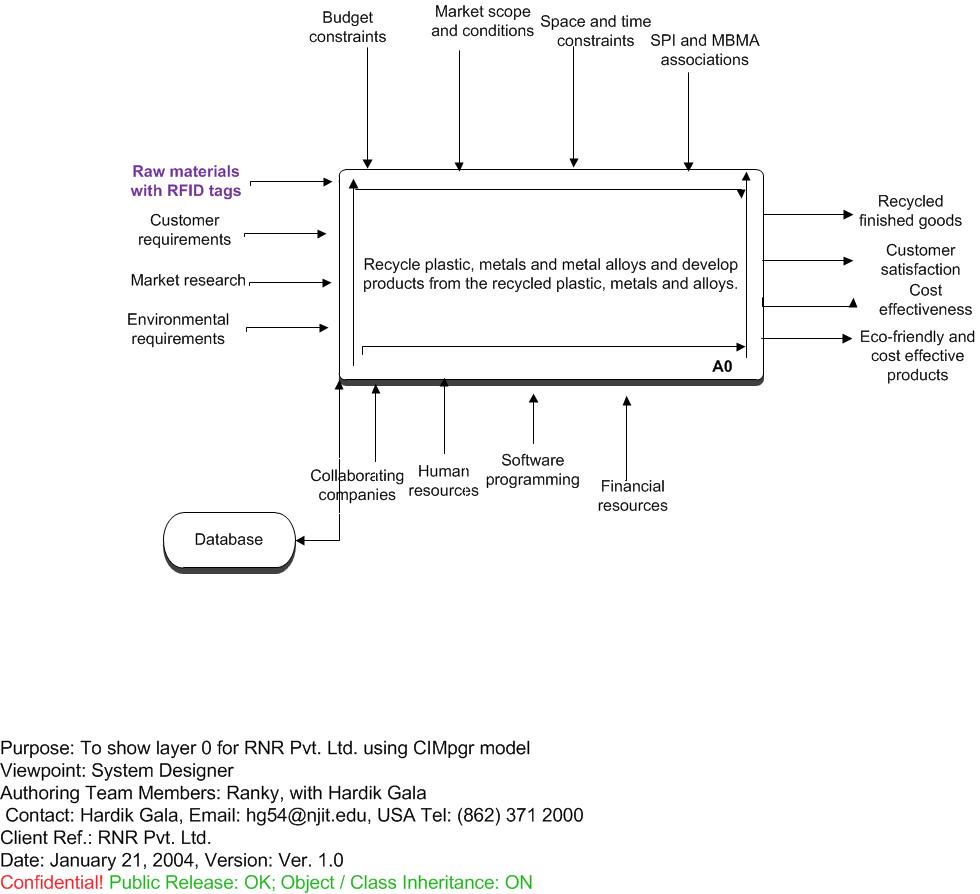
This model gives the entire overview of the process. It includes the input, control, resource and output side and database. The input side is where the data enters the system which includes raw materials, customer and environment requirements and market research. The control side is where data limits or controls the processes which include budget, space and time constraints, market scope and conditions and various associations related to the product. The resource side includes collaborating companies, human and financial resources and software programming. The output includes recycled, eco-friendly and cost effective product and customer satisfaction.
RFID is incorporated from layer 0. This will lead to overall development. In the initial stages, RFID can be used for the incoming raw materials. This will help to keep the count of raw materials. This will also help in making sure no mistake is done while identifying raw materials. This will also ensure no raw material is lost or misplaced. RFID will also be useful in knowing some information about the raw materials like incoming date, quality, weight, batch number etc.
In later stages it will help in designing of products. In the final stages it will be used for shipping purposes. This will help in tracking the products.
Updated CIMpgr Layer 0(Click here to view image)
Layer 1:
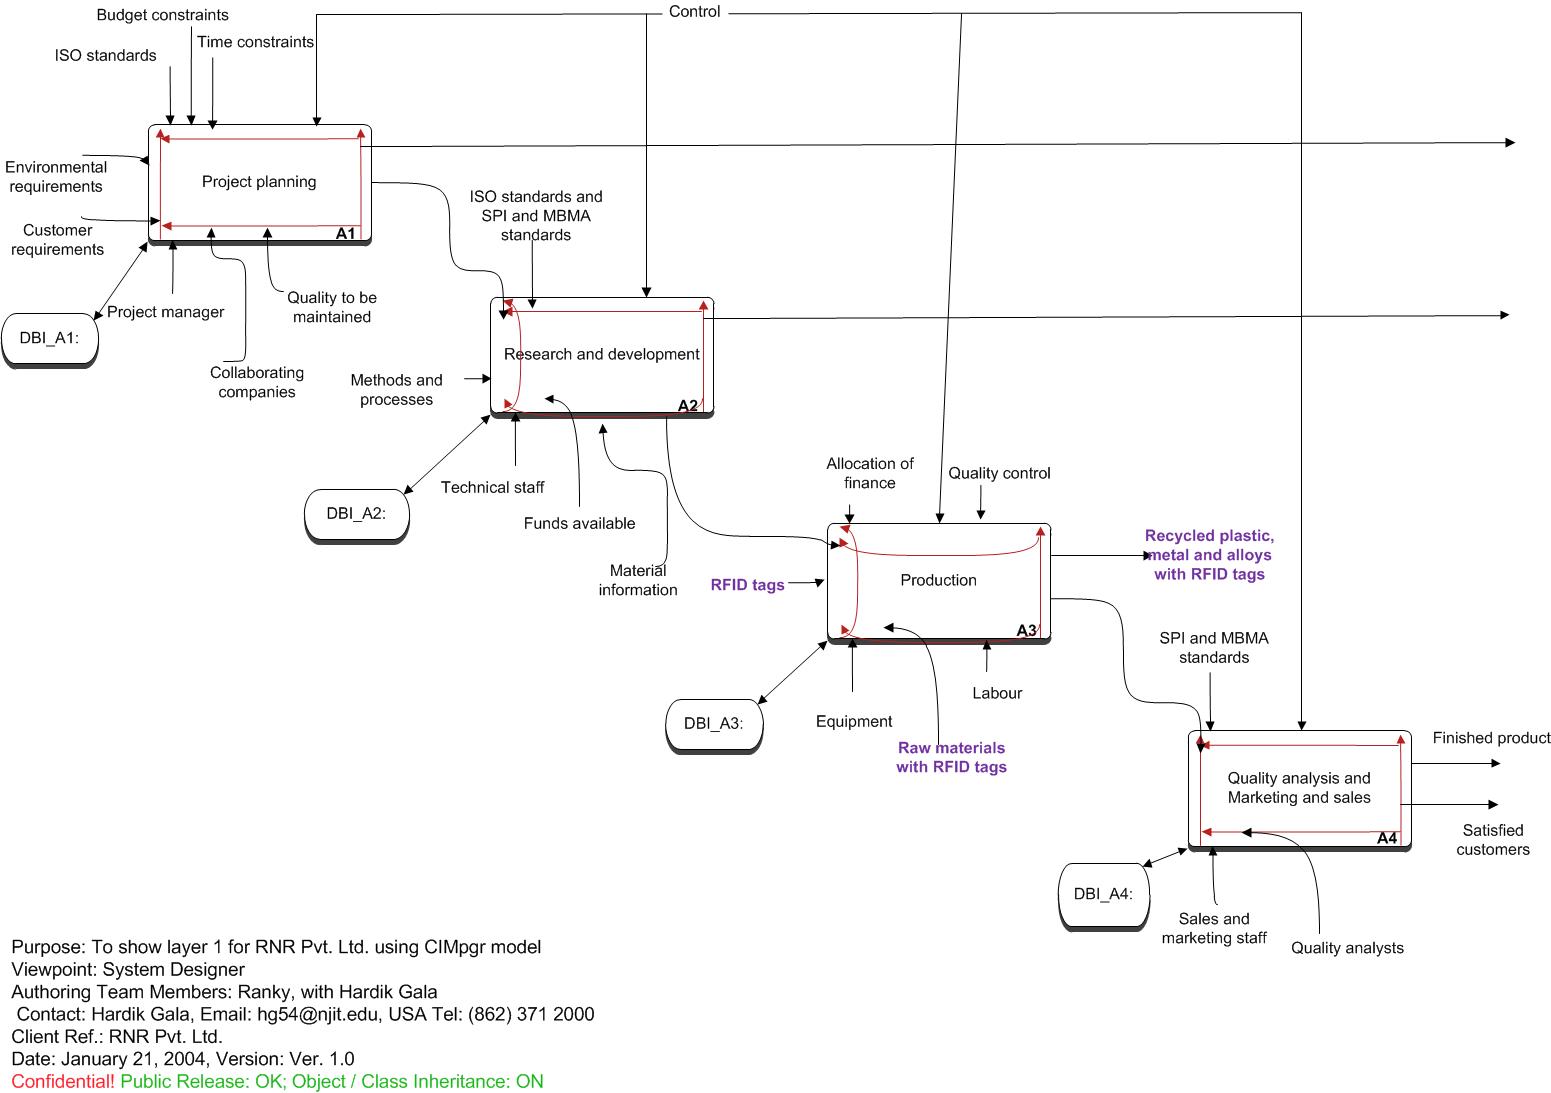
This diagram divides the parent layer into smaller components. It shows the main steps involved in the recycling process. The main steps are project planning followed by research and development followed by production and the last is quality analysis, marketing and sales. Project planning is the basis of the whole project. It is the foundation of the project. Research and development include finding ways to recycle the product. Production is the phase where the methodologies are put to use and products are manufactured. This phase is followed by quality analysis as that is our main aim. Lastly marketing and sales team work on selling the product in a better manner.
RNR is collaborating with 4 other companies. So RFID should be installed in all the companies for better functioning of the companies. Since most of the raw materials come from these companies, it would be really helpful if the same RFID technology is installed in all the 4 companies. The RFID will contain all the necessary information about the material.
Level 1 shows the steps involved in recycling of plastic and metals and then modifying it into usable form. The process will include steps like resin identification code and removing impurities and melting and finally molding it in usable form.
Updated CIMpgr Layer 1(Click here to view image)
Layer 2:
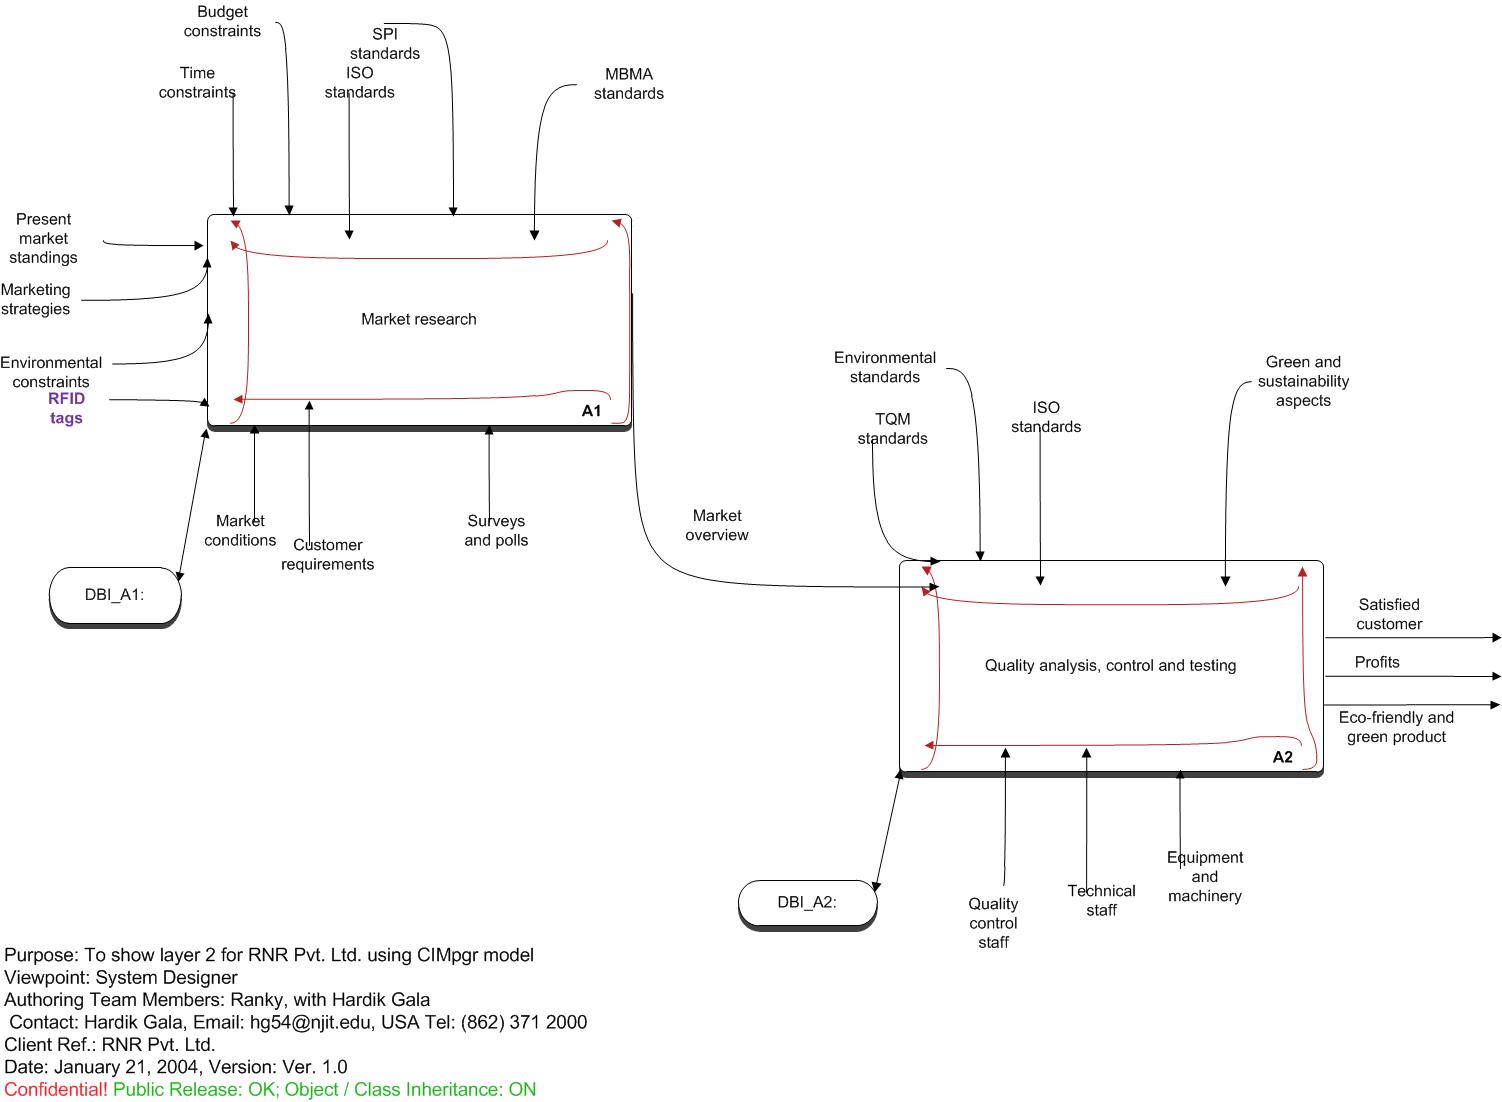
This level shows the main aspects viz. market research and quality control analysis and testing. Market research will help us know the present market standings and strategies. With the help of market standings, surveys and customer requirements we can create a good product. Next come quality analysis, control and testing. This is very important for the success of the company. If this phase goes well, we are sure of getting a quality product.
RFID technology in this layer can be used for quality analysis, control and testing. This will be helpful in easy identification of problem and help in correction immediately. This will help identify flaws in products thus maintaining quality.
Updated CIMpgr Layer 2(Click here to view image)
· RFID integration into CORA charts:
CORA is a Team Oriented Problem Solving (TOPS) method, aimed in reducing dissatisfaction and financial loss due to inadequate requirement specification and poor communication between customers and providers. The CORA chart has been updated with RFID tags which will help in increasing traceability.
The CORA spread sheet mainly consists of customer requirements on the left hand side and engineering solutions at the top. Customer requirements are rated between 1 and 5 where 1 being least important and 5 being most important. The engineering solutions created to satisfy the users are rated between 1 and 9 where 1 being low value, 3 being medium value and 9 being high value. The absolute importance values are created using the customer requirements and engineering solutions rating. The AIR values help us know the most important customer requirements.
Updated CORA analysis(Click here to CORA analysis)
· RFID integration into PFRA:
PFRA is a Team Oriented Problem Solving (TOPS) method, aimed at minimizing dissatisfaction, and financial loss for process related failure risks. PFRA is applied during the planning stages of a process, and then updated on a regular basis to document changes.
Using the PFRA spreadsheet, the management comes up with a set of processes which can cause potential risks. Then these processes are analyzed for their failure modes and how will this affect the other processes and how the management will mitigate these risks. Then the quality control team will come up with CAPA (corrective and protective actions) to ensure that the risks have been dealt with. This ensures that the ISO standards are met and a green and sustainable system has been designed.
RFID is already integrated in CIMpgr models and CORA sheet. RFID tags help in performing PFRA analysis and the risks were identified based on severity, occurrence and detection. This helped the company in understanding the risks involved in various processes thus satisfying customer requirements and producing quality product.
Updated PFRA analysis(Click here to view updated PFRA analysis)
· Quality audit:
Auditing is an essential process, because it must be part of a continual improvement process for any organization. Auditing encourages overall performance improvement processes as a permanent, long-term, continuous and sustainable objective of an organization.
More formally, an audit is a systematic and independent examination to determine whether quality activities and related results comply with planned processes and arrangements, and whether or not these arrangements are implemented effectively, and are suitable to achieve management objectives.
Audits can be conducted for internal or external purposes. Audits help to implement and enforce the continual improvement principle for the organization, to encourage overall performance improvement processes as a permanent, long-term, continuous objective of the organization.
As a minimum result, a well conducted, effective audit yields the following information for management:
· A measure of how does the current quality system conform to specified requirements
· A basis and incentive for corrective actions on any non-conformances observed
· The verification that effective corrective action was performed successfully, meaning in a timely and efficient manner.
Some important points about auditing are:
· Auditing must be a planned, systematic process, carried out according to a checklist of process steps, indicating specific items to be examined, and the manner in which these examinations should take place.
· Audit results must always be recorded and documented professionally.
· The system audit is an attempt to evaluate the effectiveness of a quality system, not the quality of a product.
· The audit process emphasizes objective evidence, and strongly discourages simple 'yes', or 'no' responses to the auditors' questions.
There are several different types of audit, including the following:
1. Internal Audit (or First-Party Audit):
It is conducted by, or on behalf of the organization itself on its own systems for management review and other internal purposes.
The internal audit may form the basis for an organization’s self declaration of conformity.
Independence can be demonstrated by deploying internal auditors who are not directly responsible for the activity being audited.
2. External Audit (Second and Third Party Audit):
Second party audits are conducted by parties having an interest in the organization, such as a customer, or by other persons on their behalf.
Third party audits are conducted by external independent auditing organizations such as those providing registration / certification of conformity to the requirements of ISO9001, or ISO14001.
3. Combined Audit:
When a quality management system and an environmental management system are audited together, this is termed a combined audit.
4. Joint Audit:
When two or more auditing organizations co-operate to audit a single auditee, this is termed a joint audit.
Auditors must have outstanding characteristics, including the following:
· Ethical conduct (the foundation of professionalism)
· Fair presentation (the obligation to report truthfully and accurately).
· Due professional care (this is the diligence and judgment in auditing).
Principles of auditing include the following:
· Independence meaning impartiality and objectivity of audit conclusions.
· Evidence-based approach, meaning a rational method for reaching reliable and reproducible audit conclusions in a systematic audit process.
Planning for Audit and the Stages of an Audit
The following questions should be asked while planning an audit:
1. WHO should be audited?
We thought of auditing our company along with all the 4 collaborating companies because all the raw materials come from the collaborating companies. This will ensure that all the quality standards are maintained.
2. WHY should be audited?
Auditing should be done to check whether all the processes carried out are perfect and a quality product is manufactured. Standards should be met and maintained. This will help us achieve maximum customer satisfaction. By performing regular audits we can check if our processes are according are sticking to the standards and ensure company is maintaining green and sustainable focus.
3. WHAT type of audit should be conducted?
Both internal and external audits should be conducted.
4. WHAT should be the depth and scope of these audits?
Scope of audit is customer satisfaction, quality control and assurance and green sustainable focus.
5. WHEN should the audit take place?
Audit should take place every quarter i.e. 3 months. After completion of one year, final audit should be carried out.
6. WHO will perform the audit?
An audit team has been set-up and it is the duty of this team to perform the audit. The audit team leader is the responsible for the preparation and completion of the audit.
7. IS the audit schedule prepared?
i. Audit Initiation
ii. Document Review
iii. Preparing for an on-site audit
iv. Conducting an on-site audit
v. Preparing, approving and distributing the audit report
vi. Audit Completion
vii. Audit Follow-up
· Application of the various methods learnt from the assignments to improve RNR Pvt. Ltd.:
§ Assignment 0
During the course of this assignment, RNR Pvt. Ltd. was established. The main aim of RNR is to reduce the wastes produced by the companies and put it to good use. Basically it makes the best out of the waste. It aims at reducing the dumping of the wastes and rather putting it to use. The company will collect wastes from each of the 4 companies and find ways to reuse and recycle it. These recycled materials can be reused again in the same companies or else can be sent to other companies which use them as raw materials. The 3 companies namely Contrinex, Mitsui Seiki and Trans Tech produce a lot of scrap and waste metal like stainless steel, titanium, nickel alloys and many more metals. So these metals can be recycled using the 5th company. The recycled metals can be in turn used in the companies itself. The leftover can be converted in to useful articles for sale. The other recycled metal which is left can also be used as raw material to other industries using those metals. Contrinex and Trans Tech mainly use stainless steel for its production. Mitsui Seiki uses titanium and nickel alloys. Stainless steel can be recycled and used back in these industries. The stainless steel which is of a bit low grade can also be used in other industries like producing utensils. Titanium is a very expensive metal. Reusing this metal will help the company a lot in reducing its raw material costs. Thus it is beneficial for all the companies. Wild Republic produces waste in the form of plastic and cloth and some amount of metals. All these materials can be used making something useful or recycled and used in some other form. Thus RNR helps all the companies in some form or the other. Most importantly it is helping mankind by reducing the load of excavation of metals from earth and reducing the dumping of waste.
By recycling the wastes we are lessening the burden on earth. We are extracting the metals from the earth on a very high intensity. Thus the use of recycled and reused metals will lessen the burden of extracting metals up to a certain extent. On the other hand plastic is very difficult to dispose. Reusing and recycling plastic will solve many of the disposal issues. The recycled plastic can be used in packaging and many other ways like reusing it in the production line itself.
§ Assignment 1-CIMpgr models
CIMpgr model is a set of diagrams that illustrates the relation between objects, their functions and resources. A typical model has a process box. This box represents the main process taking place. This is then surrounded by Inputs, outputs, resources and controls. Inputs are given in through the right side of the box and the output is obtained from the other end. Resources are shown at the bottom and the controls are depicted at the top. Controls are usually the standards that have to meet/maintained while performing that process. A complete CIMpgr model is a set of diagrams which systematically illustrate the object-to-object relationships between the objects, their functions and entities. The diagrams are often arranged in a layered, tree-like fashion, illustrating a parent-child relationship. It is a complex system in which at top of the tree there is a very high-level description of the entire system and further down the tree one goes, so the descriptions of the individual parts (objects) of the system become more detailed. Making a complete CIMpgr model of a system is an iterative process.
The CIMpgr model will help the company to evaluate and analyze the following:
· The inputs for various processes
· The resources required for the functioning of a process
· The controls for the processes.
· The output for every process and how that output will act as an input for the next process.
The CIMpgr model gives a clear picture of the processes going out in the plant. The sustainability and green aspects and quality standards are shown clearly in the models. This model will help the clients know the product planning and the processes carried out. The quality of the product is monitored continuously thus delivering quality product. Most importantly quality control and analysis is carried out so that the quality is the best. All these things will help us manufacturing an eco-friendly product thus saving the mother earth from pollution and disposal issues.
§ Assignment 2-CORA
Component Oriented Requirements Analysis (CORA), represents a systematic, customizable method, based on QFD (Quality Function Deployment) and other methods, developed by Ranky to analyze product/ process, TQM / TQC needs, including product, process, IT, service, and other needs. CORA is a Team Oriented Problem Solving (TOPS), method, aimed at minimizing dissatisfaction, and financial loss due to inadequate requirements specification, and poor communication between customers and providers.
CORA is a Team Oriented Problem Solving (TOPS) method, aimed in reducing dissatisfaction and financial loss due to inadequate requirement specification and poor communication between customers and providers
CORA chart helped us
i. Define scope purpose and function
ii. Identify user requirements
iii. Prioritize potential requirements
The main aim is to design products that not only work but are green as well and at the same time maintain the brand awareness and increase revenue. For this we have to analyze the customers’ needs and deliver it to them. The process used in this assignment is CORA i.e. Components Oriented Requirements Analysis to understand the critical requirements. Using this process we can find solutions to fulfill the needs of the requirements.
§ Assignment 3- Process improvement and Process control analysis
The Process improvement and process control analysis was used to allow us to evaluate any variations in its processes and investigate any out-of-control processes. No process is perfect and there is always scope of improvement for the processes. By using the process control charts, we can very easily find out if a process is in-control or is out-of-control. If a process is going out-of-control, it can be stopped immediately and the corrective action can be taken to bring the process back in control. If a process is found to be out-of-control, the quality team can go back and identify the root cause and change it to bring the process back in control. Corrective and Protective Action (CAPA) can be taken once the failure cause has been identified.
Control charts have been used by Geo-asset for:
· Investigating an out-of-control process and take a corrective action
· Help maintain real time quality
· Reduction of defects
· Taking the corrective and protective action when an out-of-control process has been identified
§ Assignment 4-PFRA analysis
Process-related failure risk analysis method belongs to the family of failure mode and effect analysis (FMEA) methods, and is part of our TQM and Six-Sigma approach. It represents a systematic, rule-based, quantitative and open-source computational method developed by Ranky first for disassembly (DFRA), and then for other processes (PFRA) to identify and minimize potential failure risks, and / or failures of processes in general, including disassembled sub-assemblies, objects and components, and their effects on the customer. PFRA is a Team Oriented Problem Solving (TOPS) method, aimed at minimizing dissatisfaction, and financial loss for process related failure risks. PFRA is applied during the planning stages of a process, and then updated on a regular basis to document changes.
PFRA allows the company to evaluate the risky process and helps us mitigate those risks thus helping the company to reduce waste, risk and thereby can guarantee customer satisfaction.
PFRA helps the company to
· Reduce cost associated with risky processes
· Analyze the process risks involved
· Helps the company to reduce waste and optimize various processes
· Help the company with its Green and sustainability objective
§ Assignment 5-RFID and Audit
This assignment describes the famous RFID technology and its increasing use in industries. Is also demonstrates how important RFID technology is and how it can help companies to prosper and attain the green and sustainable objective.
RNR implemented the RFID technology in almost all the processes in the company. This will enhance the processes. The implementation of RFID will also increase efficiency and accuracy of the system.
This assignment also addresses audits. It has become an integral part in all companies. It helps continual improvement. Company can learn from its mistakes using the audits and thus try and improve and serve the customers better.
· Panorama Navigation Map:
Panorama navigation map is a tool which displays the 360 degree view of an image. It reproduces the image in a live format. It allows us to view the place even though we are not physically present. All the minute details can be viewed.
This tool will be very useful when set up in the industries. All the work can be performed sitting in the office only. There will not be any need to physically go and see the machines. This method will save a lot of time. All the levels of management can watch the processes in the industry.
It can prove as a boon to all the industries. It provides an excellent view. Any mistake been done can be rectified easily with this tool. It will allow the management to take decisions quickly without even being on site.
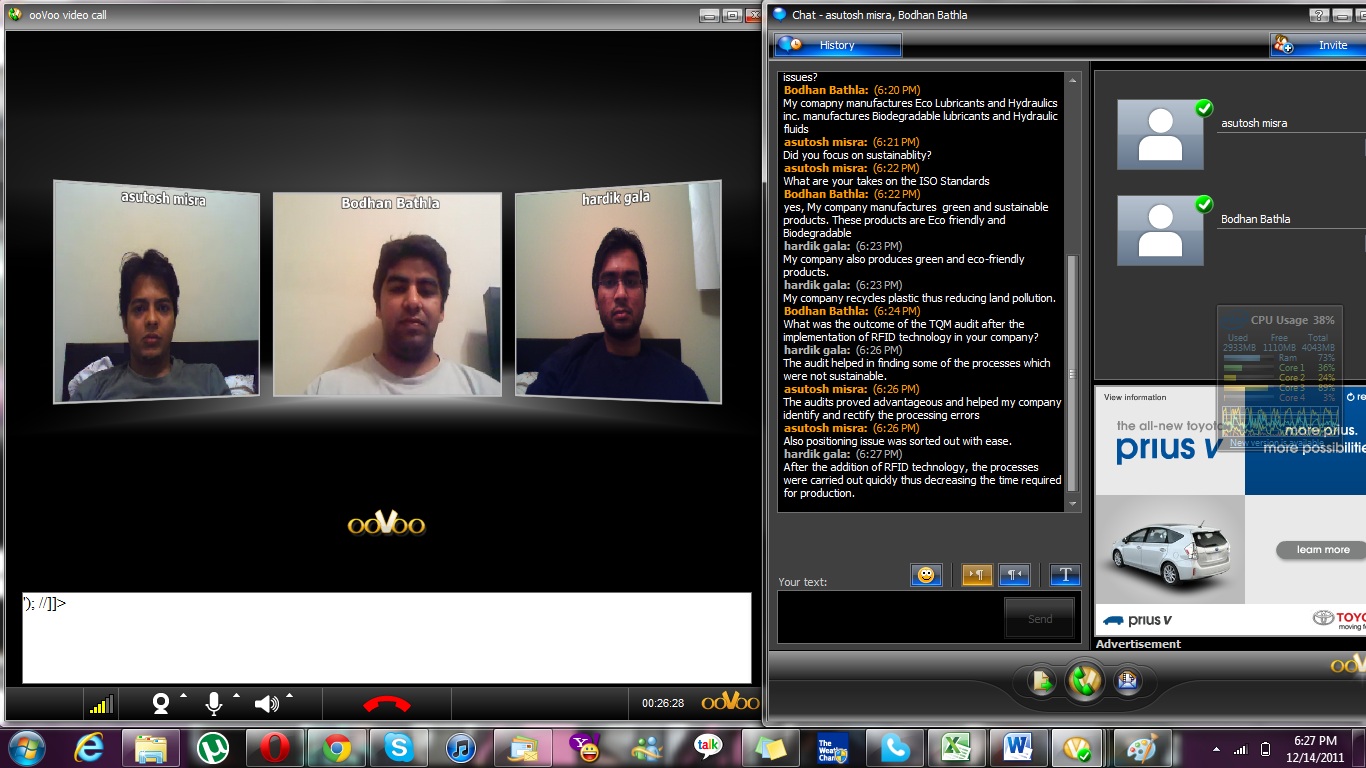
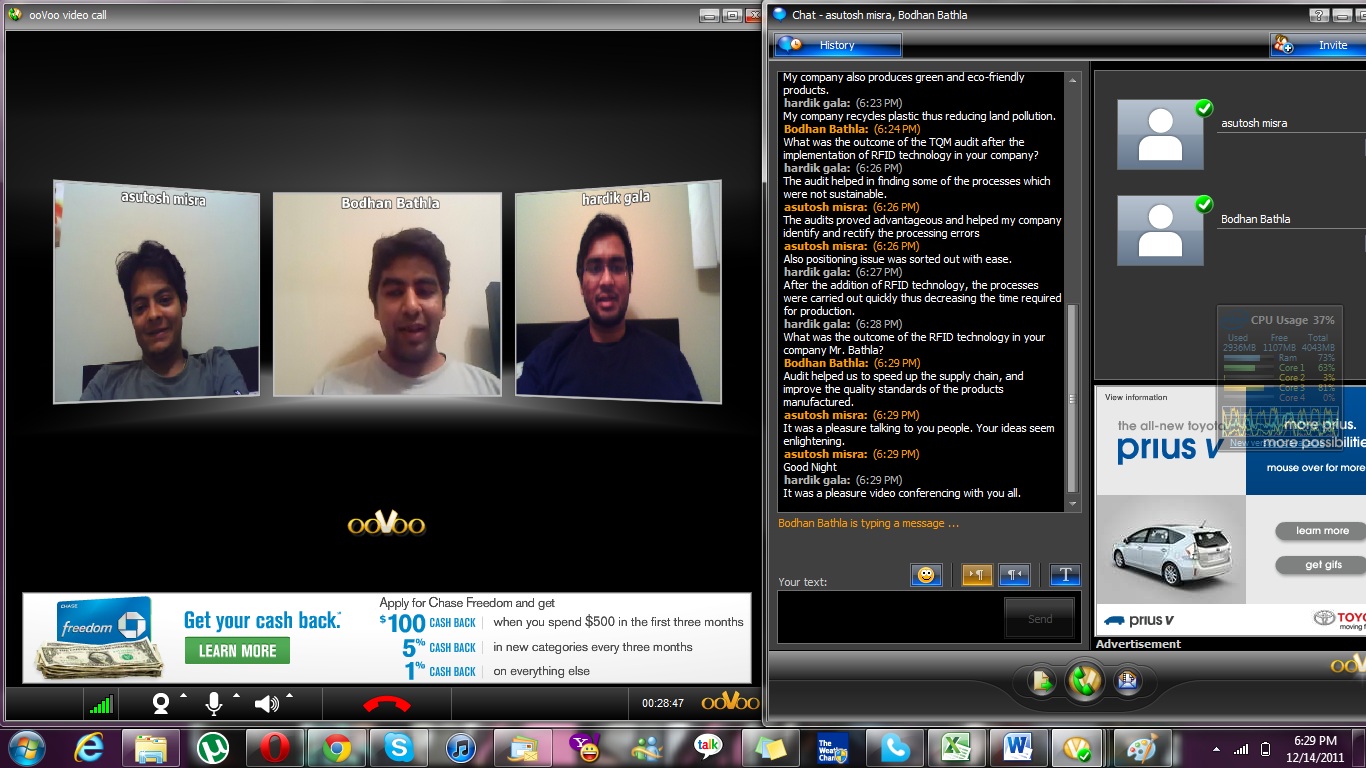
· Video conferencing:
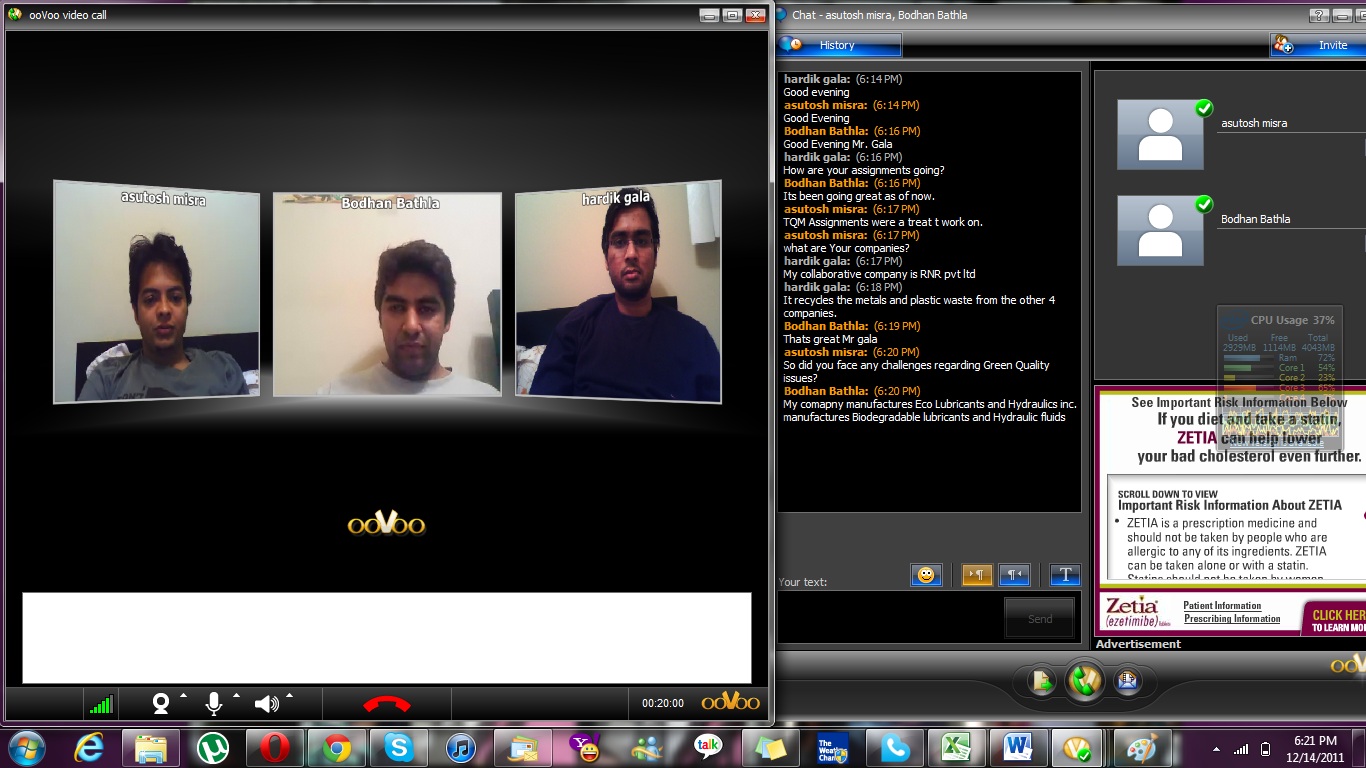
Screen Shot 1(Click here to view screenshot)
Screen Shot 2(Click here to view screenshot)
Screen Shot 3(Click here to view screenshot)
i. What was the purpose of the video-conferencing session?
Hardik Gala from “RNR PVT LTD”, Asutosh Misra from “MATRIX BURNISHING SOLUTIONS”, and Bodhan Bathla from the company “ECO LUBRICANTS AND HYDRAULICS INC.” scheduled to discuss and review Total quality management of each other companies, process and documents.The purpose of the video conferencing session was to conduct a virtual meeting between two companies and share ideas and views about improving the processes of the company thus increasing productivity and achieving green sustainable business. The various aspects of quality can be addressed without actually meeting up. Video conferencing is as extremely convenient way of saving time and increasing productivity.
ii. What software did you use for VC and how? What did you discuss and achieve during the VC session?
The software used for the video conferencing is ooVoo. ooVoo is a freely available software over the internet. We just have to download it from their website and install it. The main topic of discussion was the quality and green and sustainable aspects of the three companies. We spoke about the quality aspects related to the company. The other topic discussed how the processes are managed in order to increase productivity and efficiency. The outcome was learning a few things from each other.
iii. How do you like this video-conferencing approach for collaborative problem solving?
Video conferencing approach according to me is the best approach for collaborative problem solving. It can save time and money. There is no lack of communication because of the video. Face to face communication is very informative without the need of meeting in person. It will beneficial for the people staying in different parts of the city or country or even the world. You just need an internet connection and a handheld device and you are on. It also reduces the travel cost and thus reducing carbon foot print reducing pollution. This reduces the burden on the environment.
iv. What were the main challenges?
The main challenges were different software, network problems and hardware failure. Sometimes people seem to use different software. But for video conferencing all the people should use the same software. The internet speed varies. When it goes down there is problem in the call. The last problem is hardware failure. There may be malfunctioning with the web cam, ear phones or the speaker of the device which may affect the conference call.
v. What worked well, and what did not, and why?
All went well. There were just a few fluctuations in the internet speed which led to a few interruptions. Except that part all went good.
vi. In comparison to a face-to-face visit, versus VC, what is the estimated carbon footprint saving to the environment? How did you calculate this result?
Carbon foot print saving to the environment is. We calculated the result by using the free carbon calculators available on the internet. Our carbon foot-print was 0.02 metric tons of CO2. This is because all of us live close by, in Newark, Harrison and Kearny.
vii. What are Green Engineering benefits of using VC?
Video conferencing reduces travel. Thus carbon emissions are reduced. Thus pollution is reduced. If all the companies start using this technology instead of travelling a lot of pollution will be reduced thus following green business practices. It also allows sharing technologies and thus enhancing productivity.
· Press release:
Press Release
(Matrix Burnishing Solutions)
FOR IMMEDIATE RELEASE
RNR Pvt. Ltd. announces the release of its all new recycled plastic and metal products.
Harrison, NJ DECEMBER 14, 2011
The company manufactures recycled metal and plastic. It collects waste metal and plastic from the neighboring companies and recycles it to usable form. The products made here are all green and eco-friendly. The products manufactured here require very less labor to make and are mostly manufactured by automated processes.
RNR is an ISO 9001:2008 certified and thus it conforms to all the ISO standards and principles. ISO principles form the basis of the company’s prime objective and that includes customer focus, customer feedback, customer satisfaction, continual improvement.
It has made a substantial growth over the past few months and is still excelling further. It also collaborates with 4 other companies to provide better customer satisfaction.
Contact,
Hardik Gala
CEO
RNR Pvt. Ltd.
· Summary:
In this assignment we have seen the advantages of RFID technology. We have also seen the integration of RFID in all processes of the company. We have reworked the CIMpgr models, CORA chart and PFRA chart to integrate RFID technology. Finally we have carried out an audit to ensure continuous development of the company.
· Further Work Needed:
Some more technologies should be added to the processes to increase efficiency and accuracy. Continuous improvement should be carried out.
· References:
1. Ranky P.G. PhD, IE 673 Total Quality Management Fall 2011 eLearning Pack ID: IE673-Fall2011-60-35
2.http://www.cimwareukandusa.com/All-Green/Ranky-GreenEngineering.html
3. http://www.transtech.com/index.php
4.http://www.contrinex.ch/defaultCountry.asp?idSite=101&langage1
5. http://www.mitsuiseiki.com/
6. http://www.wildrepublic.com/WildRepDefault.aspx